Argentina's Unsung Hero
By Toochukwu Ogbonna in football
January 26, 2025
When you think of Argentina’s World Cup victory, a couple of things come to mind: Messi’s crowning moment, that Martinez save against Kolo Muani, Enzo Fernandez’s break into the world consciousness, Di Maria scoring in yet another final, Scaloni’s burst to the global scene and if you’re being a bit cynical, the five penalties Argentina had. Irrespective of what you think, there is a consensus that it was one of the most memorable World Cup tournaments, and it had one of the greatest football matches ever let alone a World Cup final culmination in what can only be regarded as the crowning moment in Messi’s illustrious career. What might not immediately come to mind, though, is the contribution of Rodrigo de Paul in that Argentina victory. Let’s explore the contributions of Argentina’s Unsung hero - Rodrigo De Paul
"He was beautiful. He was the point of difference. He has always been the point of difference. Unparalleled, and maybe today, there will, of course, always be those who argue, always be those who debate. And the debate could rage on if you like. But as he falls in love with the object in the world that his heart most desired, it is hard to escape the supposition that he has rendered himself today, the greatest of all time"
— Peter Drury
Availability
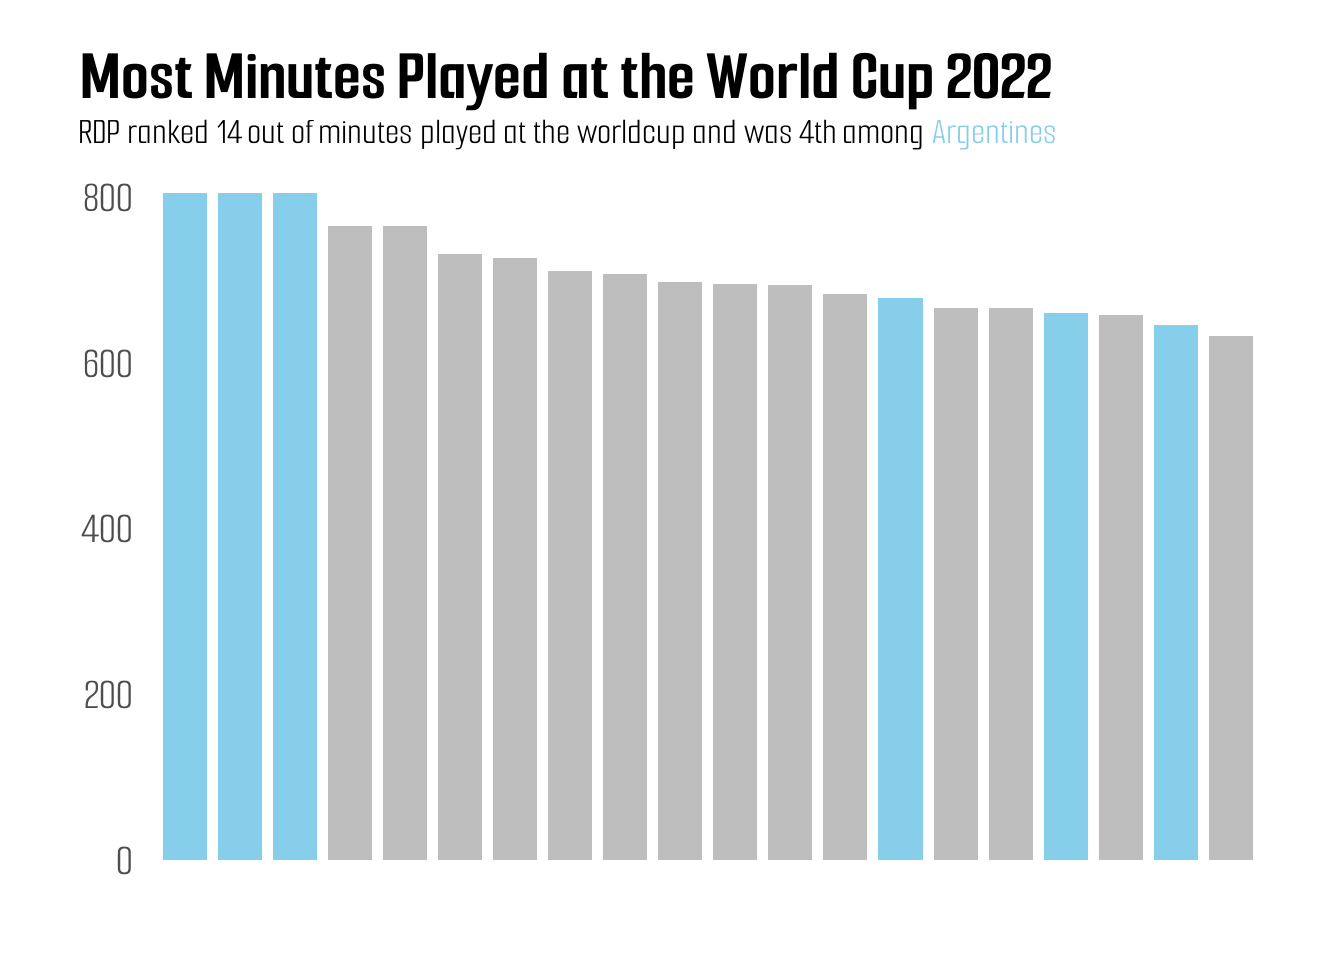
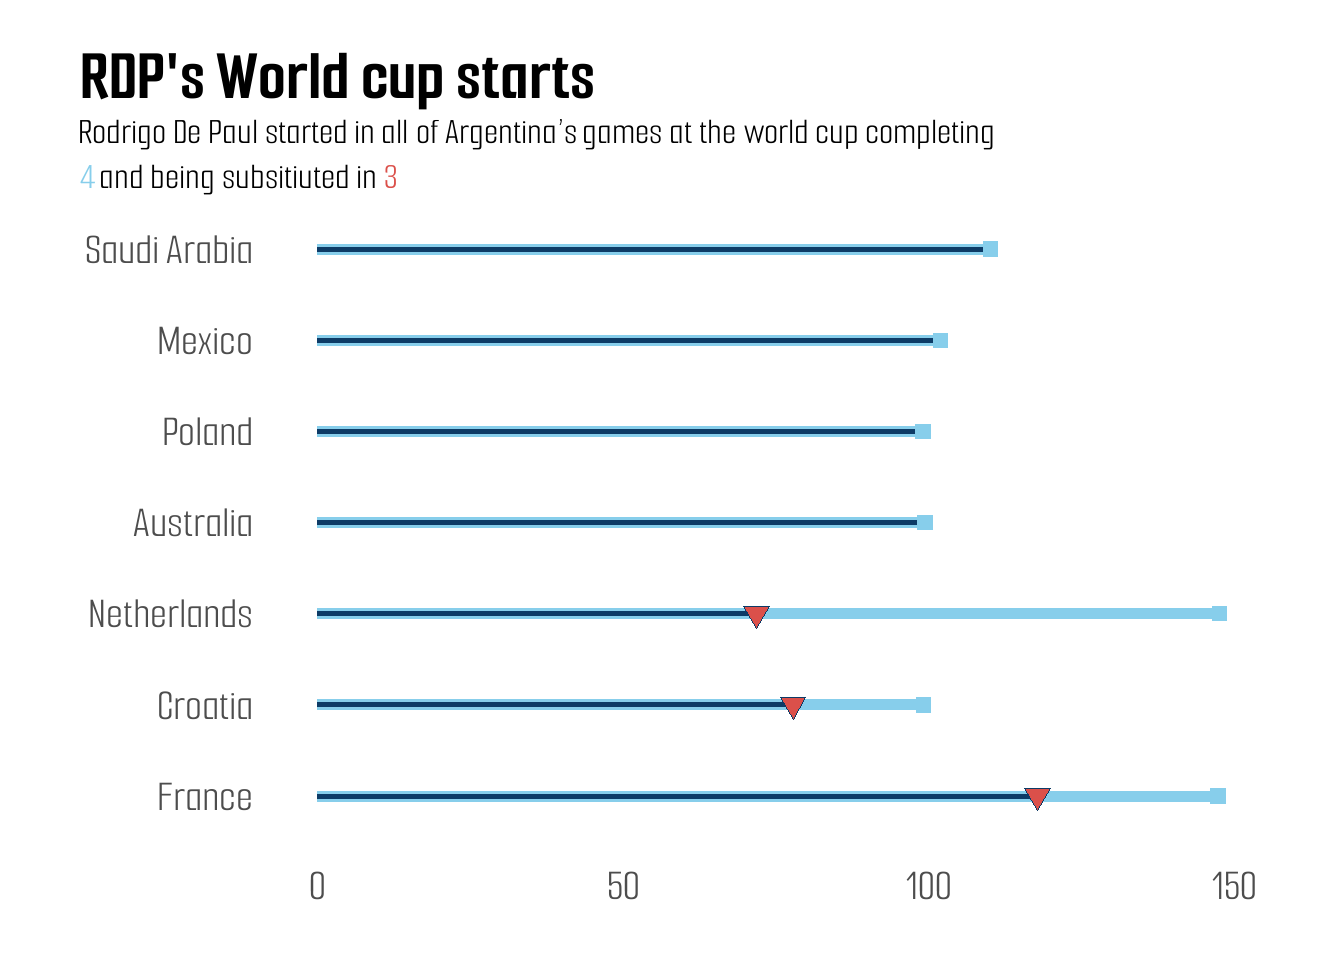
We first consider his availability before exploring what made him especially important in the 20202 World Cup run. While injuries are common in any sport, and no player is immune or exempt from injury, every manager prays they can always field their best eleven in a seven-game competition. Rodrigo de Paul avails himself of this wish. He Started all seven games, completed three, and played a combined total of minutes. He was fourth in minutes played among Argentines behind Lionel Messi, Emi Martinez and Otamendi.
“Availability is the best ability.”
— Charles Barkley

When he was substituted against the Dutch Argentina were already a goal up and were 3 goals up and when he was substitute against the Croats.

Centrality
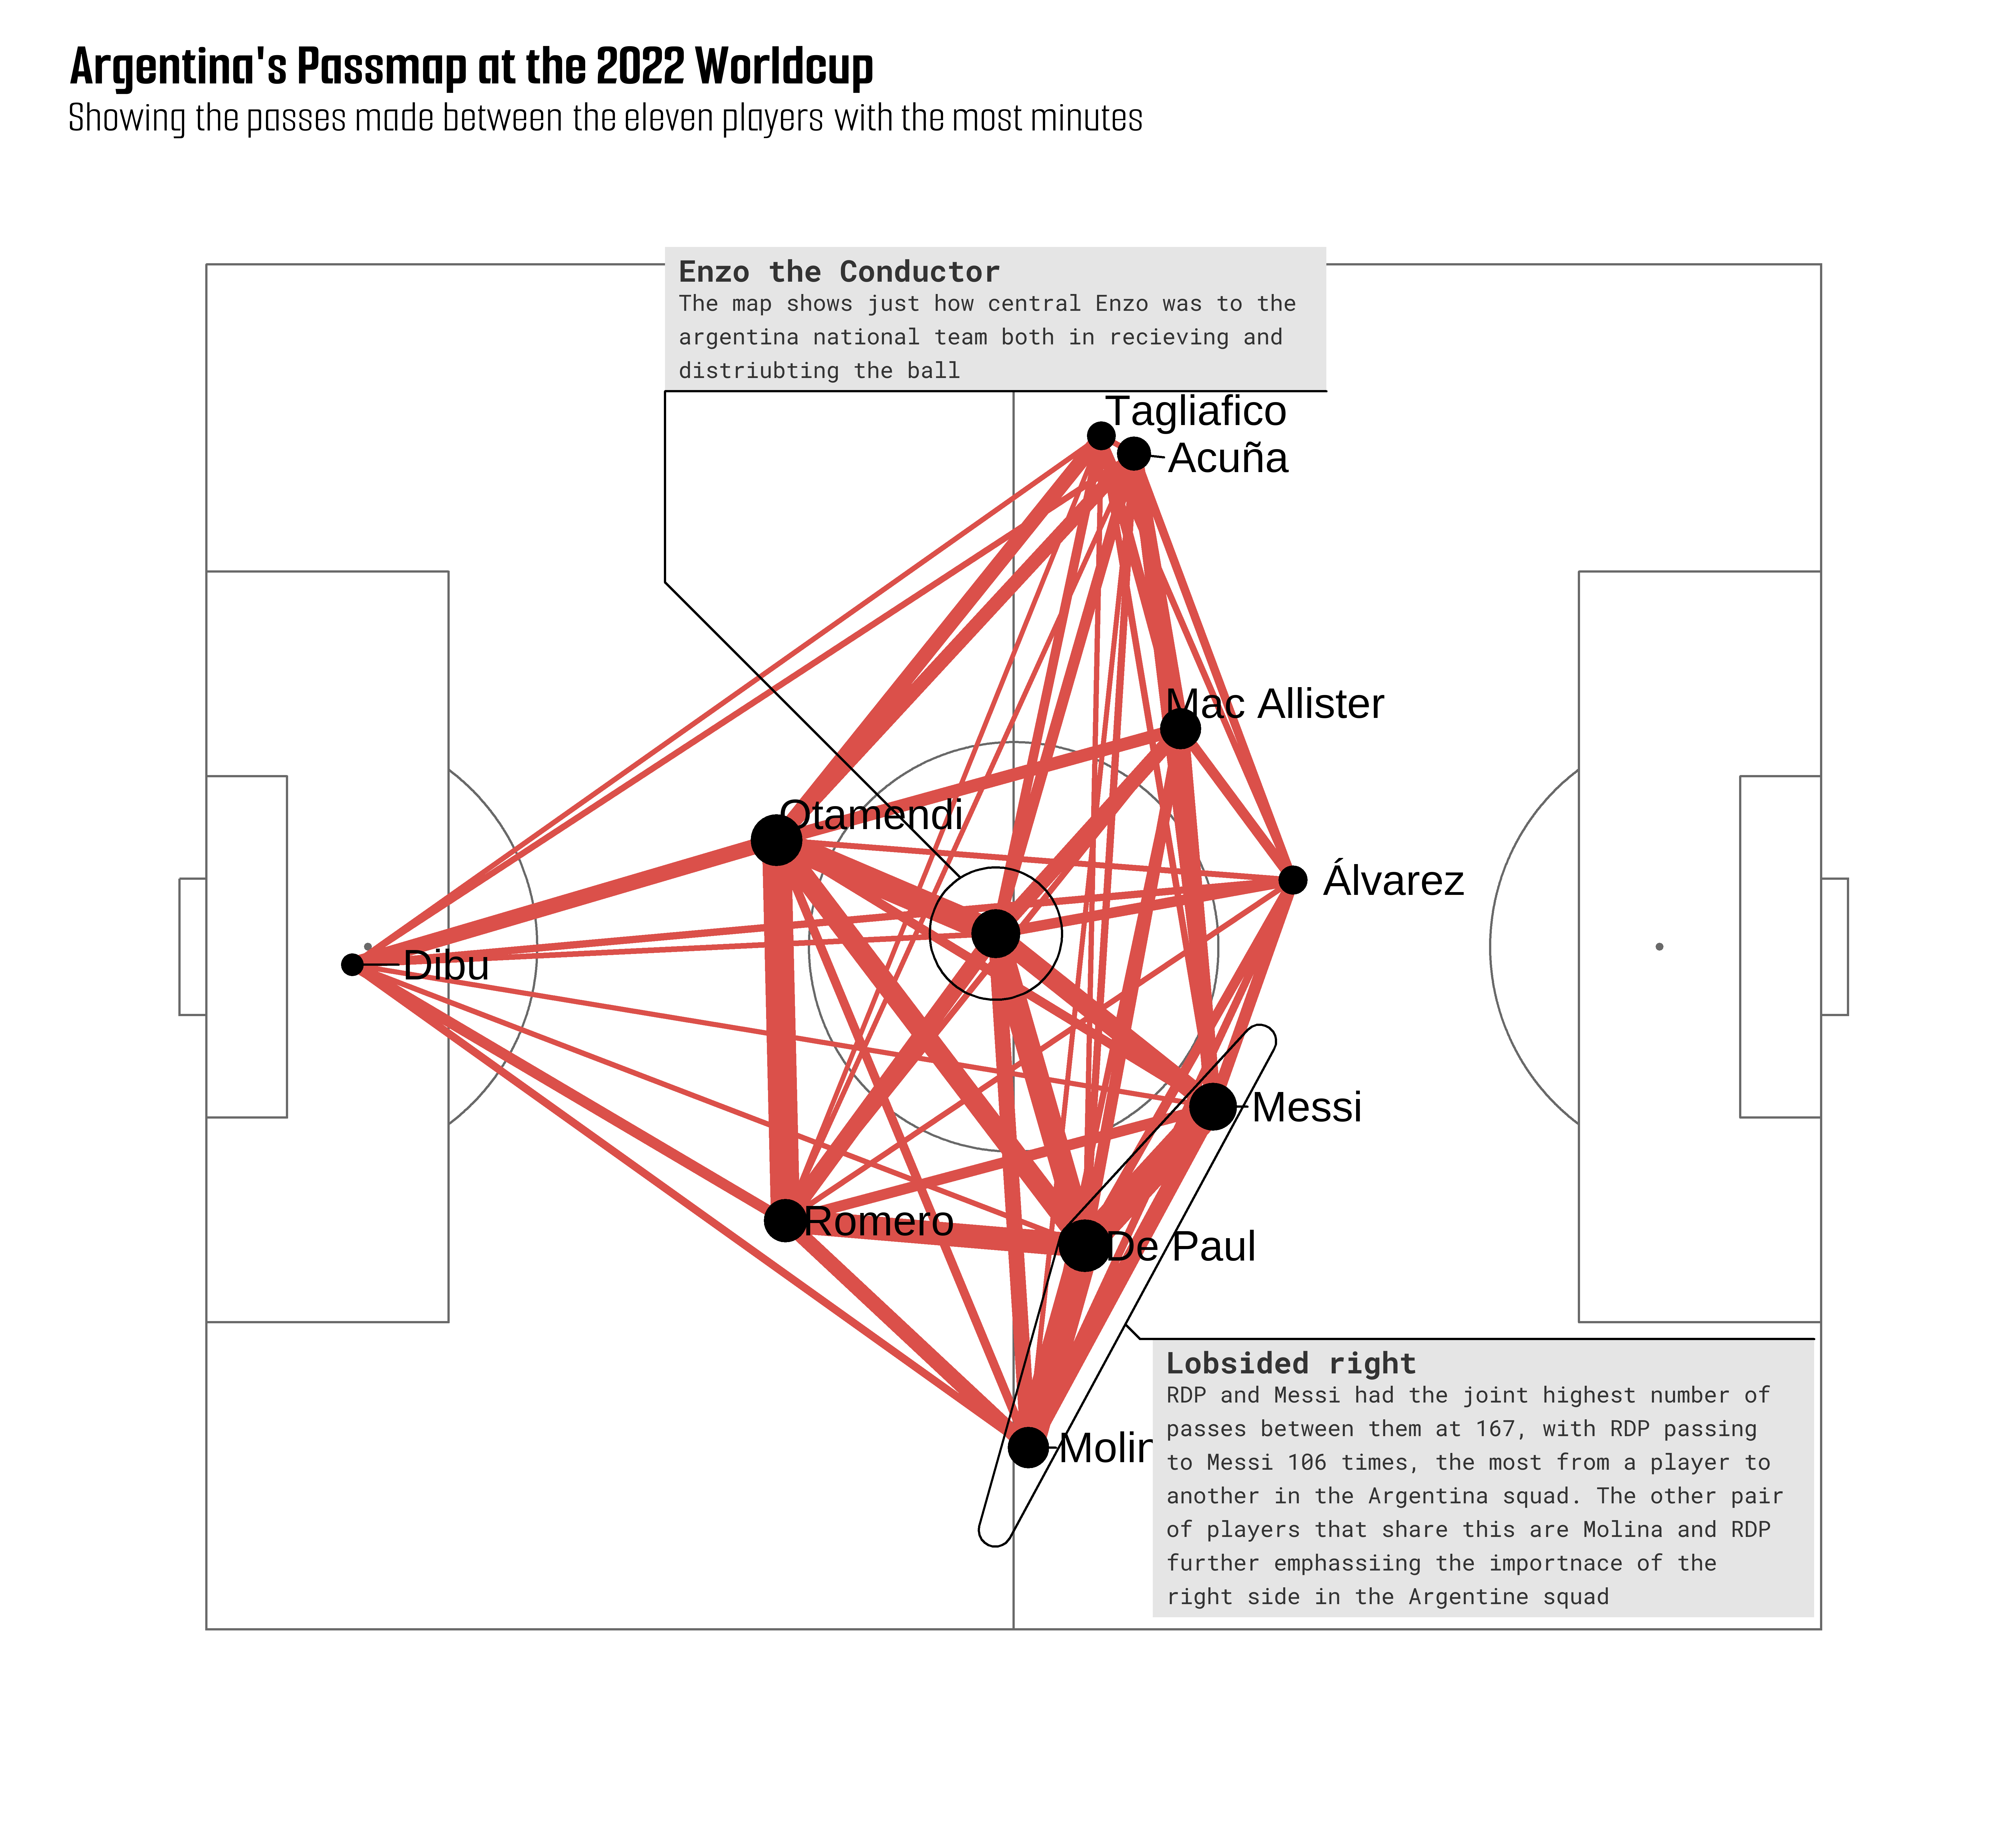
Graphs and networks are a good way to measure the influence of elements in a system, so we’ll explore just how important RDP was to this Argentine team. Before going into the finer details, we can see from the pass map how central Enzo was to the way the team was set up, both literally and figuratively; he made the teamwork, but we could argue that the RDP’s role was just as important if not more; he made Messi work. The gameplan seems simple enough, Molina to RDP to Messi, showing just how dependent Argentina was on that right-hand side; the fact that both Taglafico and Acuna, who are both left-backs, were among the top 10 outfield Argentine players with the most minutes and Di Maria, who also plays on the left side, isn’t among the shows just how reliant they were on the right side.

Figure 1: passmap
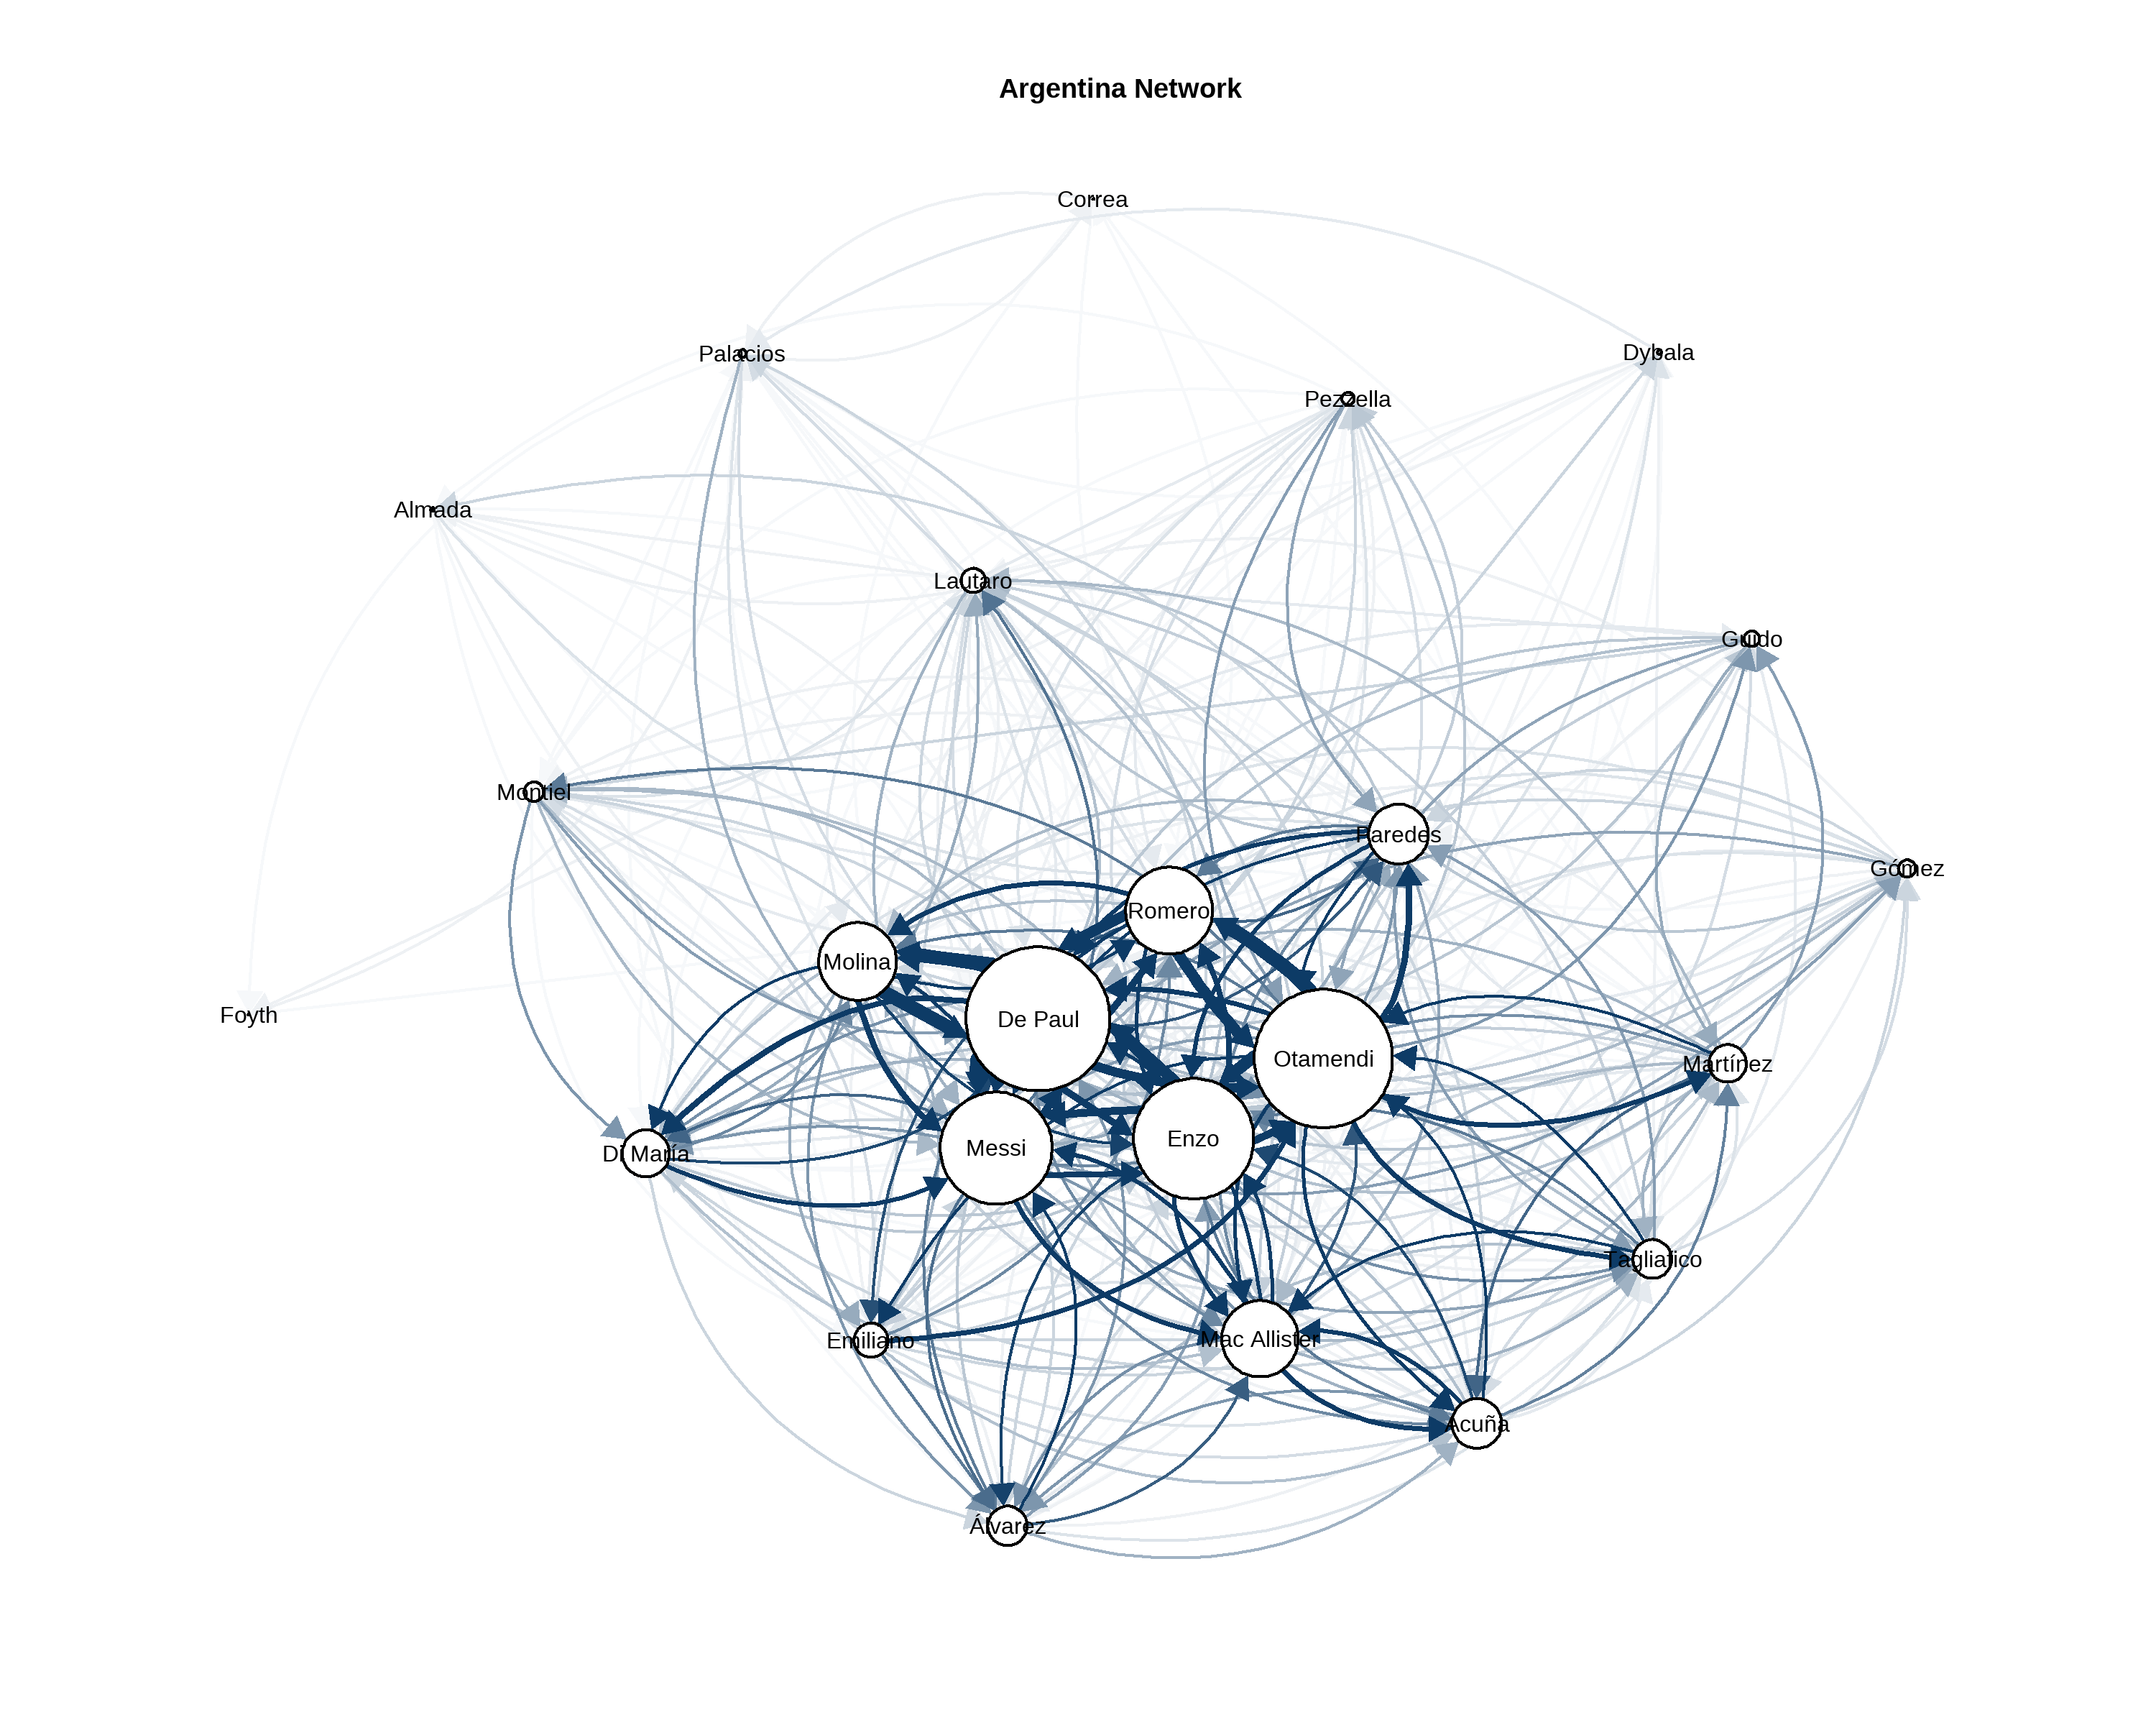
Using the graph networks show essentially the same thing as the pass map shows. What we can, however, do with the maps is that we can quantify just how important he was to the team as a whole

Figure 2: Argentina Network Plot
The node size corresponds to the number of passes given and received, and the thickness of the lines represents the number of passes given. This gives us a clearer picture of the player’s influence.
First, we examine some descriptive measures of network systems and then consider the player’s influence on the system in terms of the measures.
-
Degree centrality is the most straightforward and intuitive measure of centrality; it simply depends on the number of edges each node has. In the context of football and this data, it merely shows how many passes a player has received. Since we have passes made and passes received, measuring the IN (passes received) and OUT (passes given) Degrees is possible. The combination of both is just called the Degree. The Degree is equivalent to the player’s size, which is already represented in the pass map and the graph above.
-
Betweenness Centrality measures how important nodes or players are to the flow of a network; a node or player with high Betweenness facilitates the movement of information or the ball in football. By calculating the shortest path between nodes, we can get betweenness centrality. The Betweenness of players in a game can demonstrate how a team plays; if the team prioritises passing it from the back and playing through the middle, we can expect its defenders and midfielders to have higher measures of Betweenness.
-
Closeness centrality indicates how close a node is to another node in the network. It shows how close players are to each other in terms of receiving passes from other players.
-
We measure the influence of the players in the network using the page rank and eigen centrality algorithms, while they are similar - the PageRank is based on the eigen- they are still different. Eigen depends on the number of connections a node has, and the number of connections each node it connect to also has iot rewards for nodes that have connections to highly connected nodes. Page rank differs from the Eigen in that it also accounts for the indegrees of the node, which the eigenvector does not.
| Network Descriptive Stats | ||||||
| Player name | OutDegrees | InDegrees | Closeness | Betweenness | PageRank | Eigenvector |
|---|---|---|---|---|---|---|
| De Paul | 537 | 509 | 0.354 | 182 | 0.108 | 1.000 |
| Molina | 282 | 284 | 0.324 | 0 | 0.060 | 0.708 |
| Romero | 346 | 285 | 0.346 | 0 | 0.057 | 0.719 |
| Otamendi | 547 | 458 | 0.364 | 275 | 0.089 | 0.861 |
| Enzo | 451 | 422 | 0.352 | 69 | 0.090 | 0.837 |
| Acuña | 173 | 189 | 0.296 | 0 | 0.044 | 0.347 |
| Mac Allister | 263 | 292 | 0.304 | 16 | 0.069 | 0.507 |
| Messi | 345 | 468 | 0.327 | 181 | 0.109 | 0.969 |
| Álvarez | 112 | 173 | 0.263 | 0 | 0.040 | 0.335 |
| Di María | 145 | 197 | 0.281 | 0 | 0.045 | 0.418 |
| Emiliano | 162 | 85 | 0.321 | 43 | 0.020 | 0.194 |
| Tagliafico | 143 | 138 | 0.288 | 0 | 0.035 | 0.266 |
| Paredes | 236 | 198 | 0.317 | 44 | 0.046 | 0.409 |
| Pezzella | 49 | 41 | 0.236 | 0 | 0.015 | 0.084 |
| Lautaro | 60 | 116 | 0.204 | 0 | 0.031 | 0.196 |
| Almada | 12 | 13 | 0.114 | 0 | 0.009 | 0.020 |
| Montiel | 65 | 76 | 0.229 | 0 | 0.020 | 0.164 |
| Martínez | 149 | 123 | 0.287 | 0 | 0.029 | 0.242 |
| Guido | 60 | 53 | 0.226 | 0 | 0.016 | 0.101 |
| Palacios | 28 | 28 | 0.214 | 85 | 0.022 | 0.037 |
| Gómez | 57 | 67 | 0.210 | 0 | 0.020 | 0.138 |
| Dybala | 12 | 18 | 0.088 | 22 | 0.010 | 0.026 |
| Foyth | 3 | 3 | 0.065 | 0 | 0.008 | 0.000 |
| Correa | 4 | 5 | 0.064 | 0 | 0.008 | 0.004 |
| Highest values | ||||||
The summary shows first how Argentina played. This is a team that favored patient buildup up from the back, this helps explains Otamendi’s high betweenness and out-degree scores. It also depended a lot on advancing the ball through central spaces, this is reflected by the fact that the players with the highest between scores are midfielders and, of course, Lionel Messi and they had few if any true out and out wingers capable of hugging the touchline and producing width in the wide spaces. When checking the important players firstly with the page rank algorithm, we see that Messi ranks highest, but RDP ranks highest when using the eigenvector centrality. However, this shows how the algorithms evaluate the importance of elements in a network. Despite the difference, Messi is second in the Eigenvector WHILE RDP IS second using Page Rank; again, strengthening the team’s right side was where the magic happened.
In conclusion, we see just how important Rdp was to Argentina’s world cup Triumph. He allowed Messi to function, by repeatedly getting him the ball and covering for him defensively.